
TLT (iShares 20+ Year Treasury Bond ETF) is an ETF that invests in U.S. government bonds, and its price moves inversely to Treasury yields. TLT can serve as a hedging tool in an investment portfolio, especially when there are expected fluctuations in interest rates or Treasury yields.

Source: Google. TLT price at July 23rd, 2024 was $92.52.
In early July, as the market anticipated a 100% probability of a Fed rate cut in September, both TLT and TMF (Direxion Daily 20+ Year Treasury Bull 3X Shares) came into the spotlight. Many people endorsed these two ETF products, expecting that TLT and TMF would grow outstandingly along with U.S. rate cuts.
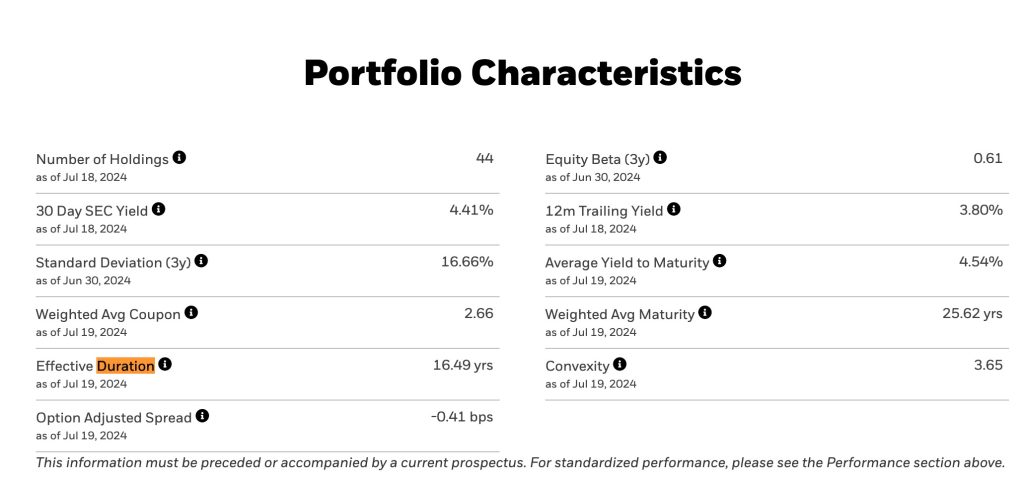
According to the latest dot plot information disclosed by the Federal Reserve, the U.S. will enter a slow rate-cutting cycle lasting three years from 2024 to 2026. Based on current data, TLT has a duration of approximately 16.49 years, many people think that if the U.S. cuts rates by 1%, investors could at least receive a 16% return. If rates return to the low levels before 2020, this return could exceed 50%, making it very attractive.

People often simplistically believe that rate cuts are beneficial for assets. For instance, rate cuts stimulate real estate purchases and are a driving force for stock market rises.
Many well-known financial bloggers have also introduced this fund in their special reports. It seems that in a rate-cutting cycle, bond prices rising is a sure thing, making the rise of TLT a certainty.
But is that really the case? Could TLT cause us to permanently lose our principal? Meanwhile, we see that Warren Buffett is not attracted by these seemingly foolproof long-term Treasury bonds; instead, he has gone in the opposite direction by heavily purchasing short-term Treasury bonds.
What is the reason behind this?
Basic Facts
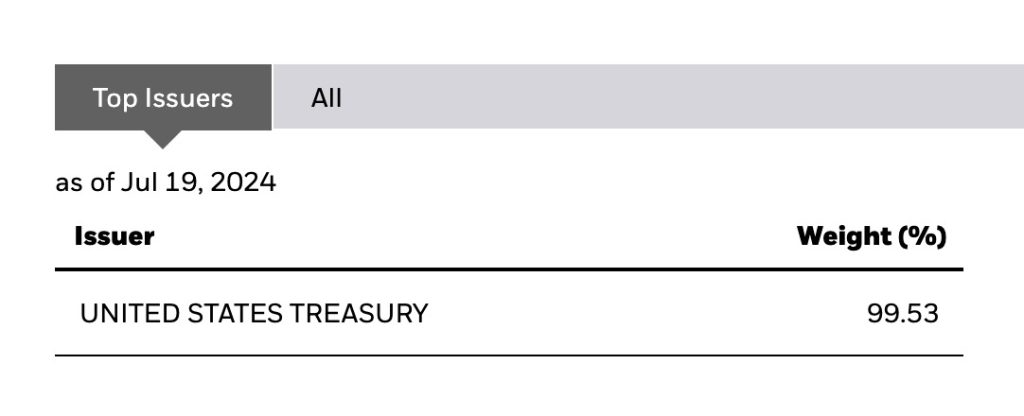
TLT is a fund product under iShares by BlackRock, currently with a volume of 32 million and a net asset value of $53.01 billion, making it a leader among U.S. bond ETFs. It is a fund that specifically invests in U.S. Treasury bonds with maturities of over 20 years, with almost all assets invested in Treasury bonds and only 0.9% held in cash.
The average maturity of the Treasury bonds that TLT invests in is 25.6 years, and the effective duration disclosed by the fund company is 16.48 years. This means it is a long-term bond fund.
We know that TLT has an inverse relationship with the yields on 10-year or 20-year Treasury bonds. When Treasury yields fall, the price of TLT rises; when Treasury yields rise, the price of TLT falls.
In early 2021, the price of TLT was around $163, while the yield on 10-year Treasury bonds was between 0.76% and 0.9%. Throughout 2021, as interest rates rose, the price of TLT dropped significantly. By comparing charts of TLT and 10-year Treasury yields, this inverse relationship can be clearly observed.
Generally speaking, TLT can be invested in through options or direct stock purchases. Investors can use TLT to hedge against the risk of fluctuations in interest rates or Treasury yields.
Since U.S. Treasuries are backed by the credit of the U.S. government, they have a high level of investment safety. The bond market is larger than the stock market but receives less discussion.
Treasury term premium
Before we analyze TLT, we need to understand the concept of Treasury term premium, which refers to the extra yield that investors demands for holding a long-term Treasury bond instead of a series of short-term bonds.
Basically, if the term premium is rising, the price of long-term bonds, thus TLT, will decrease.

It is firstly noted that the U.S. Federal Reserve primarily adjusts only the short-term interest rates through its monetary policy actions, such as setting the federal funds rate. However, the impact of these adjustments extends beyond short-term rates and influence long-term Treasury as well, largely through the concept of the term premium.
[The Fed directly controls the federal funds rate, which is the interest rate at which banks lend ot each other overnight. This is the short-term interest rate, and the Fed influences it through open market operations, such as buying and selling short-term government securities. By increasing or decreasing the supply of money in the banking system, the Fed can raise or lower this rate, making it the primary tool for monetary policy.]
The premium compensated investors for the additional risks associated with holding long-term bonds, such as interest rate risk and inflation risk.
Assume we have the following two investment options:
A short-term Treasury bond that matures in one year with a yield of 2%
A long-term Treasury bond that matures in 10 years with a yield of 4%
As we can see, the long-term bond has a higher yield (4%-2%=2%) than the short-term bond, and part of the higher yield compensated the additional risks borned by the investors for holding the bond for a much longer period of time.
For example, over the 10-year period, the interest rate might rise again, which would decrease the bond’s value (as yield increases); or the inflation might erode the purchasing power of the bond’s future payments over the long term.
Therefore, the long-term Treasury yield is composed of two main components:
First, the investors’ expectations of how short-term rates will move over the life of the bond;
Second, the additional compensation investors require for the risks of holding a long-trerm bond, due to uncertainties about the future interest and inflaction.

As we can see, in the last four years, the term premium has decreased to a negative level with -0.1%, which means that investors are willing to accept a lower yield on long-term bonds, despite their low yields, compared to the expected path of short-term rates. This happens when there is a significant demand for safe assets, especially during times of economic uncertainty or financial crisis.
In the chart, the negative term premiums observed around 2020 and onwards could be likely attributed to a combination of factors, like the aggressive monetary policies and market conditions during the Covid-19 pandemic, which heightened the demand for safe assets and reinforced expectations of prolonged low-interest rates.
Besides, during the period, central banks such as Fed, have at times engaged in QE, buying long-term government bonds to influence long-term interest rates. This also increased demand for long-term bonds.
In brief, the term premium can be influenced by three factors: inflation, monetary policy, and supply and demand of Treasury bonds.
While the market might expect the Fed to cut rates, the extent and the duration of those cuts are uncertain.
Some investors might assam a linear and straightforward impact on long-term bonds from these cuts, but it is not so direct, as there might be some other factors.
For instance, a small cut in short-term rates might not proportionally impact long-term bond yields.
If the Fed cuts short-term rates by 0.50%, investors might, due to other factors, be concerned abou the long-term inflation or economic stability. They might demand a higher term premium, keeping long-term bond yields relatively stable despite the rate cut.
This could limit the price increase in long-term bonds, thus TLT, making the investgment less lucrative than expected.
Suppose the Fed is expected to reduce short-term interest rates. Investors might assume that this will lower yields on long-term bonds (like those held in TLT), make them more valuable. However, if the cuts are smaller than expected, or if economic conditions suggest that rates will not return to pre-pandemic levels, the impact on long-term bond yields might be less significant than anticipated.
For instance, if the Fed only cuts rates by 0.25% when the market expect 0.50%, long-term bond yields might not fall as much as expected, and the prices of long-term bonds might not rise significantly.

U.S. Treasury yield curve (as of August 13th 2024) with the yield to maturity (YTM) for various materities of U.S. Treasury securities, ranging from 1 month to 30 years. Source: ustreasuryyieldcurve.com
Typically, the yield curve slopes upwards, reflecting higher yields for longer maturities due to the additional risks and the time premium associated with holding long-term securities, as mentioned above.
However, based on the yield curve (as of August 13th, 2024), the current yield curve shows a downwards slope initially, indicating an inverted yield curve, which suggests that short-term rates are higher than some longer-term rates, often a signal of market concerns about economic growth or future rate cuts. Markets anticipate the Fed might need to cut rates in the future to stimulate the economy, which is why long-term yields are lower.
[To some degree, it can be a measure of the expected rates of different securities that the market anticipates.]
Let’s get back to the Treasury Term Premia chart, in July, as the term premium is low or negative, long-term bonds tend to have lower yields, which can be beneficial for TLT investors if they are seeking capital appreciation. This is because lower yields generally result in higher bond prices.
However, we can also see that the term premium starts to rise, indicating that investors are demanding higher compensation for holding long-term bonds, which could lead to falling bond prices, negatively impacting TLT.
Meanwhile, the price of TLT has been increasing with around 5% in the last two weeks because the markets have priced in with rate cut expectation.
Besides, as TLT has a duration of 16 years, which means 1% rate cut would result in 16% price increase. If Fed only cuts in September with 25 base points (0.25%), this could only lead to a quarter of 16%, or 4% increase for the price. The price now could have reflected the pricing in.
If Fed might cut twice with 50 base points, which would bring a 8% increase in TLT price, there is not many growth left in the coming 5 months, not to mention the risks and the opportunity cost. It would be a good option to buy in if there are some drops for the TLT prices.

That said, based on the data in the last 10 years about TLT price and the Treasury Term Premium, they had complicate relationship in different periods.
For most times (2013 to 2017, and 2019 to 2020), they had inverse relationship; in some other times, their relationship have same growing or decreasing patterns (from 2022 to 2023).
For example, in 2020, due to pandemic, the term premium dropped significantly due to aggressive monetary policy measures and uncertainty, leading to a sharp increase in TLT prices.
In brief, the chart demonstrate some inverse relationship between TLT prices and Treasury term primia, but there are still many factors to weigh in for investors in uncertain times.
Other Factors Affecting TLT Prices
TLT holds U.S. Treasury bonds with maturities exceeding 20 years. However, bond prices fluctuate, especially during interest rate hike cycles. Due to the inverted yield curve, the prices of long-term Treasury bonds can decline.
Additionally, some bonds in TLT’s portfolio gradually have maturities of less than 20 years. To maintain the fund’s positioning, the fund managers need to sell these older bonds and buy new long-term bonds to keep the effective duration of the holdings in line with the fund’s objectives.
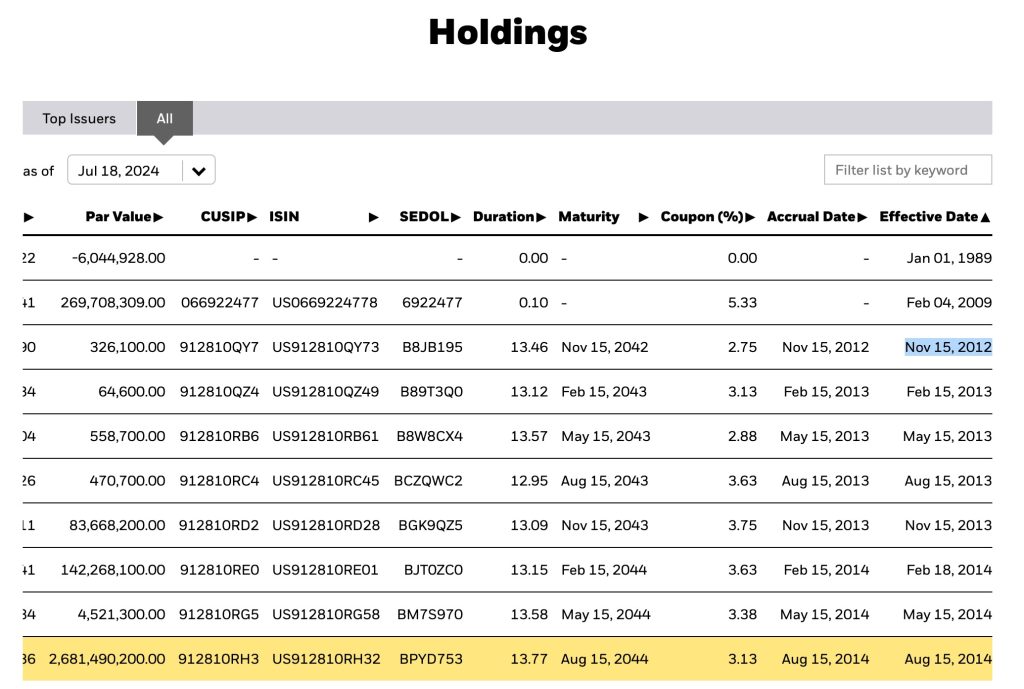
When selling older bonds, the decline in their prices can negatively impact TLT’s price, and this effect might have a time lag.
Therefore, the first risk point of TLT is that changes in bond holdings can result in permanent gains or losses, unlike bonds that are held to maturity, which return the principal.
Risk is Not Low
More importantly, TLT’s opportunity cost needs to be considered. Every investor has limited funds, and if they allocate their capital to TLT, they have less available to invest in individual stocks like Nvidia, Tesla, or other members of the Magnificent 7, potentially missing out on greater growth opportunities.
Many people believe that TLT is less risky than stocks of technology companies, but this is not the case.
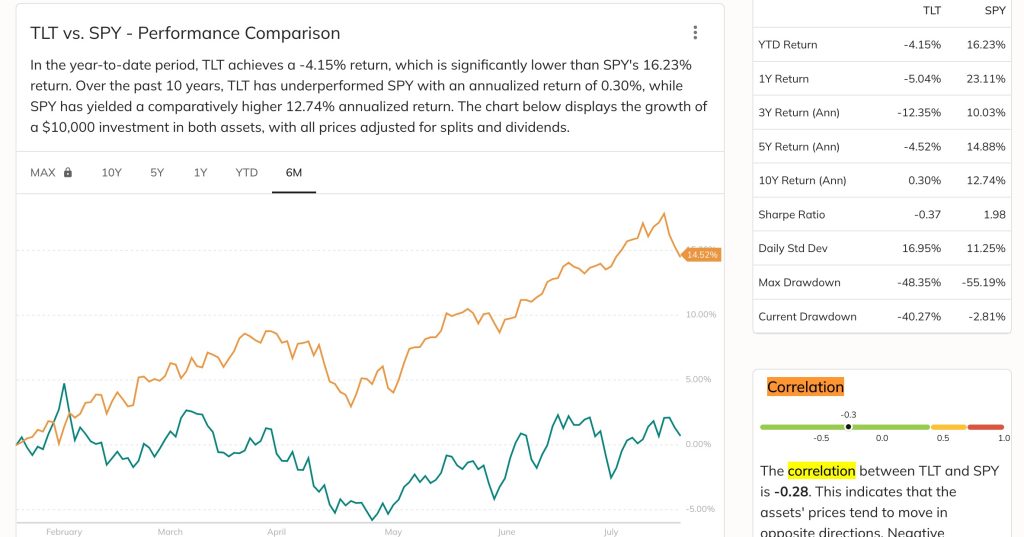
Comparing TLT to the S&P 500 index ETF product, SPY, during recent bull and bear markets shows that the risk of TLT is higher. Over the past decade, TLT’s maximum drawdown was 48%, occurring at the end of an interest rate hike cycle, whereas SPY’s maximum drawdown was 33%, occurring at the onset of the COVID-19 pandemic. This indicates that TLT’s risk is actually greater than SPY’s.
Who would have thought that long-term bonds, often perceived as fixed-income securities with low risk, actually carry more risk than the S&P index?
Negative Correlation with SPY
Research indicates that TLT and SPY exhibit a negative correlation, with a correlation coefficient of -0.28. Statistically, this means that if the S&P index rises by 1%, TLT tends to drop by 0.28%.
In the following scenarios, TLT’s performance may outperform SPY:
During an economic recession or financial crisis, when stocks plummet, the U.S. stock market declines rapidly, and investors’ risk aversion drives them to the bond market as a safe haven. Consequently, the bond market rises, and TLT follows suit. Once the stock market crash subsides, the funds in bonds can be reallocated to buy stocks at lower prices.
Therefore, during economic crises or black swan events, holding a certain proportion of TLT is akin to having a relatively safe cash reserve to balance the risk between stocks and bonds and to seize bottom-fishing opportunities.
Opportunity Cost
However, if the U.S. economy merely undergoes a mild correction or a slowdown in growth, the stock market might still continue to rise. In such cases, the opportunity cost of holding TLT can be very high. On one hand, TLT’s returns could be inversely correlated with SPY, and investors might miss out on potential gains from a rising stock market.
If a rate cut does occur, TLT would likely rise in advance because interest rates are determined by the market, or more precisely, guided by the Federal Reserve’s policy tools to influence short-term rates. However, rate cuts benefit both bonds and stocks, so TLT is not necessarily the best choice.
TLT is riskier than SPY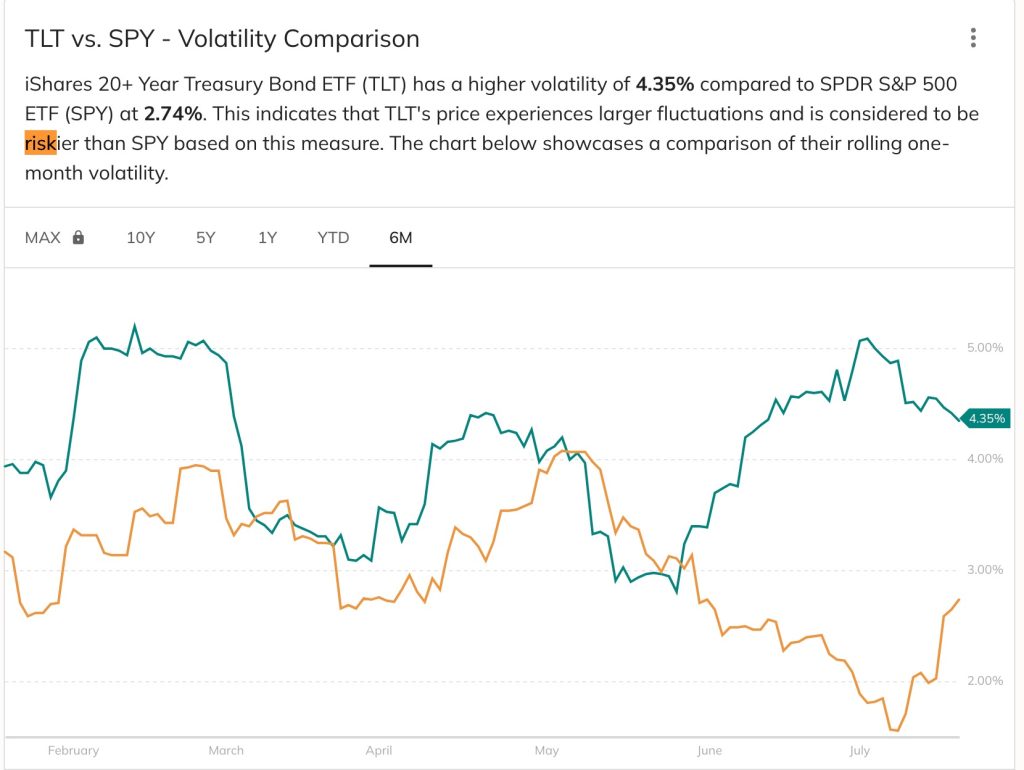
Therefore, I have always felt that the logic of investing in TLT is not entirely coherent. If one seeks dividend income, it might be better to invest in short-term high-yield bonds utilizing the inverted yield curve. The capital gains from rising bonds equate to having a long duration. But remember, stocks, especially tech stocks, also behave like long-duration assets.
So for those looking to invest in long-duration products, it might be better to directly buy Magnificent 7 or AI stocks. The prospects and even the certainty of gains seem higher than with TLT.
Duration changes
In TLT’s key parameters, we see that its effective duration is approximately 16. Sometimes people simplistically say that if the risk-free rate rises by 1%, TLT will drop by 16%.
However, this is not entirely accurate. A 1% change in interest rates does not necessarily result in a 17% fluctuation in TLT. Two years ago it was 16.8 years and now it is about 16.4 years. Accordingly, the return by 1% change will also be changed.
Duration changes along the curve as you can see. For instance, if the current interest rate drops from 5% to 4%, the increase in TLT is different from when the rate drops from 3% to 2%. A small decrease from a high rate yields a smaller gain, while a small decrease from a low rate results in a larger gain for bonds.
Conclusion
The TLT is more riskier than you think, for example, than SPY. Meanwhile, the return of TLT can beat SPY only in very serious recession and stock crisis.
Although it could be attractive that investing TLF would have some price hike with the marketing anticipating the coming Fed rate cut, it is still uncertain how, when and how frequent the rates are cut in the coming months.
Investors should think twice about investing in TLT based on their own preference in risks and returns, if they understand the risks and uncertainties within, especially the United States are facing election in the end of this year. Some polls estimates a higher probability of Trump’s return to White House, and the 100%-sure rate cut would be quite uncertain.
—
Iscore Advisor:
The content in any of the Iscoreadvisor.com webpages shall not be construed as financial advice and may be outdated or inaccurate; it is your responsibility to verify all information.